How It Works by Dr. Dyno, American Iron Magazine, July 2006
Dyno Dos And Don’ts, III
Why all dynos don’t necessarily give the same results
An inertia dynamometer, such as the typical Dynojet unit found in most performance shops, is a simple device. Its important components consist of an 875-pound, freespinning drum with a one-pulse-per-revolution sensor that’s connected to a computer that counts the pulses and computes the results. How the computer figures out the horsepower is a straightforward computation using the drum’s weight, acceleration, and velocity. To display the engine speeds at which the horsepower occurs, as well as calculate the torque that produced it, an inductive pickup is connected to the ignition system, usually on a spark plug wire.
As far as measuring horsepower, the only difference between one Dynojet unit and another is the precise weight of the moving components, which are the drum, shaft, and, if so equipped, the disc or electric brake. The exact rotational mass number for each dyno is stored in its computer’s memory. It’s hidden in the dyno program and is very well disguised — can you say reverseoffset hexadecimal coded?
So, getting an accurate dyno reading is very simple, right? Put the bike’s rear (driven) wheel on the drum and run the bike up, and we should get the same answer every time from every Dynojet unit. Correct? Well, though I once said, “The only thing that can go out of calibration on an inertia dyno is the operator,” there are several easy ways an operator can misrepresent (a nice word for fake) dyno results, even without hacking into the dyno’s software.
This article will expose some of the tricks that I’ve seen used to pick up power that somehow doesn’t translate to the road. I call it power on paper. This is power you see on a chart, and you probably paid for it, but you can’t feel it when you open the throttle. We’re also going to cover several legitimate reasons, especially on Harley-Davidsons, why “results may vary,” even when the operator is honest and experienced.
THE BASICS
Let’s start at the beginning. You bring your bike to the dyno and fill out a waiver. You should read it. Expect it to release the operator from responsibility if something unforeseen goes wrong. But before you get this far, you should have watched the operator run enough bikes to have the confidence that if something does go wrong, it will be unforeseen and not the operator’s fault. If the release is cleverly written to get your money regardless of any benefit you may receive, believe that that’s exactly what’s going to happen, and walk away. One unscrupulous operator I saw in Sturgis apparently only wanted the customer’s money. Once the customer signed the waiver, he paid, even if he began to see through the hoax and wanted to leave. The operator’s three helpers saw to that. More on this bad apple later.Your bike then gets loaded onto the dyno, and your information is entered into the computer. My personal preference is to enter the customer’s name and bike info, so that it will appear on every run I do. If a run is generically named “dynorun,” how do you know it’s yours?
Next, watch to see if the dyno is equipped with an exhaust air/fuel ratio tester. And if it does have one, does the operator use it? In the age of EFI, every up-to-date dyno should have air/fuel ratio capability. (The Sturgis bad apple didn’t need one for his charade.) If the operator hesitates to use it, he may know that the air/fuel ratio graph is going to raise questions he doesn’t want to address. The air/fuel ratio is the single best indicator of state of tune available, so insist it be measured and displayed.
WARM-UP RUNS
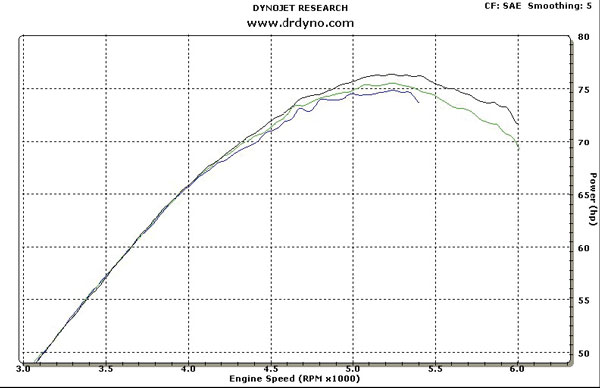
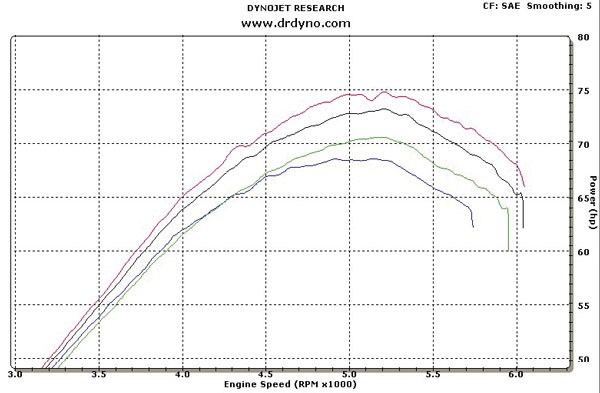
The operator should now warm up the bike. Dyno runs are the best way to do it, since the whole drivetrain gets warmedup, not just the engine, which is what happens when the bike is idled. Here’s why: The first run is not an accurate baseline test, because the second run will almost always be higher. In fact, it typically takes three or four runs to get two runs similar enough to constitute a valid baseline test. The first run may also be low because it’s not a full-rpm run. However, even a first run to the rev limiter on a Harley will put out less horsepower than a fully warmedup machine. For example, at Americade last summer, I tested two 2004 Road King Classics owned by two brothers, Steve and Joe. I tested Steve’s bike about 10 minutes after they rode in together one 80-degree morning. As shown on the graph called Steve’s Warm-Up Runs, the bike picked up only a couple of horsepower, but there was an increase, even though the bike was certainly warm when it went onto the dyno. As for Joe’s bike, it had been sitting for about half an hour by the time I ran the baseline test on it. The graph shows an almost 6-hp increase during warm-up. Here are the resulting horsepower measurements (rounded to tenths and taken in fifth gear):
STEVE & JOE WARM-UP RUNS
| Run Number | Steve | Joe |
|---|---|---|
| Run 001 | 74.8 | 68.6 |
| Run 002 | 75.5 | 70.6 |
| Run 003 | 76.3 | 73.2 |
| Run 004 | N/A | N/A |
| Run 005 | N/A | 74.8 |
I didn’t tune either bike yet, but the power numbers kept going up. Now, let’s say I had tuned Joe’s scooter up a few horses to 78.8. That’s an actual increase of 4 hp, about a 5-percent gain. That’s nice, but barely noticeable on the road. However, if I could get Joe to fall for Run 001 as his baseline, I could claim a 10.2- hp pickup! That would figure to a significant 15 percent power boost on paper. Of course, it would also be barely noticeable on the road.
Suppose Joe had gone to another dyno where the operator had convinced him that too many dyno runs aren’t good for bikes. He’s told the bike is plenty warm, and, therefore, only needs one run. Jokers who use this trick may not even crank up the engine to full throttle or full rpm, but for the sake of argument, let’s say Run 001 was done right and the operator came up with our example of 68.6 hp. Joe is told, “She’s running fine.” (That’s easier to do without an air/fuel ratio graph to explain.) Joe gets handed a printout, is relieved of 60 to 70 bucks, and sent on his way. Not bad money for only 30 seconds of dyno work.
Now here’s where this goes from bad to worse: What if Joe decides to spend another hundred bucks on a “full dyno tune-up”? Okay. While he watches, the spark plugs, regardless of how new they are, and the air filter, even if it’s a K&N, get changed. The operator does a few more runs and the horsepower comes up to 74.8, the same as our Run 005. Impressed with the 6-hp “gain,” Joe says to himself, “This guy really knows what he’s doing,” and rides away happy. His bike feels faster in about the same way it does after he washes it. But Joe is right about one thing: The guy does know exactly what he’s doing. He’s making a quick buck off anyone he can. And the same trick works on every bike, every time. Just ask our Sturgis bad apple.
Most dyno operators aren’t that unscrupulous, but this one-run baseline technique is used all the time to fake increases on products that don’t work, and to show larger-than-actual boosts on parts that do actually work. For instance, on a stock Harley, replacing the restrictive stock air cleaner assembly with a highflow air box and filter (for off-road use, of course) gives about a 10 percent increase in peak horsepower. On a Twin Cam, that’s about six to eight ponies, resulting in, typically, 68 to 70 hp. But if the operator can keep the “before” test down to 55 to 57 instead of 60 to 62 hp, the results look twice as good. Or, maybe those “extra” six or seven came from your new $400 carburetor.
Throw in an $800 exhaust system as a package deal and the “after” horsepower may hit the mid-70s. The actual increase of nine or 12 ponies looks like 18 or maybe even 20. And though there is an actual improvement, it’s just not quite as much as was represented. That’s pretty harmless in this case, and it does make you feel better about the chunk of change you just spent. You will feel the difference, and, after all, your bike is a little better than the next guy’s, isn’t it?
The point here is to avoid getting fooled and maybe also ripped off. Insist on a valid set of warm-up runs as a baseline, not just one run. The bike should be run until two lines on the screen lie practically on top of each other. That may take as few as three, or as many as five, runs.
QUICK PONIES
Did you know it’s also possible to display higher than actual power readings? If you tell the dyno operator that you just want to see how much horsepower and torque your bike is putting out, you can bet most aren’t going to stop with one run, with a result of 68.6 hp, for example. Especially if you mention you had it on another dyno, which you thought was reading low. They’ll likely keep doing runs until they hit 74.8 hp, right? But what if they (or you) wanted a little higher number? That brings us to correction factors and smoothing.
All dyno measurements are affected by air density. Cool, dry air allows an engine to generate more power than hot, moist (humid) air, which is less dense. If dyno software didn’t correct for temperature and humidity, we could never get consistent readings, even on one dyno in a fixed location. To compensate for these variables, modern dynos have hardware modules, which measure temperature, humidity, and barometric pressure automatically. Truth is, all dyno software has built-in correction factors, but it’s the operator who gets to select which one is applied.
Dynojet’s latest software package (WINPEP7) offers the following correction factors: SAE, STD, DIN, EEC, JIS, and UNCORRECTED. SAE and STD are US standards, whereas DIN and EEC are European, and JIS is Japanese. Each one figures in temperature, humidity, and barometric pressure a little differently. Uncorrected means no correction is made to the raw measured data. According to Dynojet, SAE is the proper factor for tests done in the US, and it’s the one I use exclusively. But as you can see from the chart titled Dyno Correction Factors where I applied the other factors to the Road King tests, it also gives the lowest readings. (Uncorrected gave even lower readings because I did the runs on a warm, humid morning.)
DYNO CORRECTION FACTORS
| Name | SAE | STD | EEC | DNI | JIS | UNC |
|---|---|---|---|---|---|---|
| Steve | 76.3 | 77.8 | 76.5 | 76.4 | 76.6 | 74.1 |
| Joe | 74.8 | 76.2 | 75.2 | 74.8 | 75.0 | 72.8 |
To those who use STD, a correction factor superseded by SAE in 1990, I say, “You’re only 16 years behind the times.”
Smoothing, or lack of it, can also “create” power. Maximum smoothing (5) gives the most accurate readings, whereas minimum (0) “roughens” the lines such that the top of the peaks where the program reads the horsepower and torque numbers get higher. As you can see in the chart titled Dyno Chart Smoothing, I could “gain” another half to one horsepower using 0 as the smoothing. Let’s stick to SAE/5 and stay real. I’m encouraged to see that SAE/5 is what most dyno operators are using.
DYNO CHART SMOOTHING
| Name | SAE/5 | STD/5/4/3 | STD/2 | STD/1 | STD/0 |
|---|---|---|---|---|---|
| Steve | 76.3 | 77.8 | 78.0 | 78.4 | 78.6 |
| Joe | 74.8 | 76.2 | 76.3 | 76.4 | 76.6 |
FOURTH OR FIFTH GEAR?
Let’s start with the basics, okay? We are trying to measure the engine’s horsepower and torque output. Where are we measuring it? At the rear tire, where it counts, right? Did you know that power losses occur between the engine crankshaft and the contact patch of the tire? These are called drivetrain power losses. The primary drive (whether it’s via chain, belt, or gears), transmission, final drive (be it chain, belt, or shaft), and the tire all introduce losses. All have mass, and power is used to get them moving. In this argument, we’ll ignore the primary and final drives, since their losses are most likely pretty constant and independent of the transmission gearing and rear-wheel speed.
The transmission in a sportbike is similar to the manual tranny of a frontwheel- drive car: It’s a simple two-shaft system. The input and output shafts are mounted side by side. Each has five or six gears, which mesh with their counterparts on the other shaft. The gear ratios are determined simply by the number of teeth on the drive gear divided by the number on its driven mate. With no reason for a 1:1 ratio set, there usually isn’t one, and at least two ratios are overdrive. Power is always transmitted through one gear mesh. For our purposes, this means a nearly constant power loss, regardless of which gear we’re in on the dyno.
A Harley-Davidson Big Twin transmission, on the other hand, is patterned after the four-speed (or three-speed — remember them?) gearbox of a rear-wheel-drive car. The output shaft is concentric with the input shaft. The only difference is that power goes in the front and comes out the back in the automotive application, whereas Harley mounts one shaft inside the other so both shafts come out of the left side of the transmission. In high gear, the input and output shafts are simply locked together, giving a 1:1 ratio and minimal power loss. (If the neurons are flowing, the lightbulb above your head should be starting to come on about now.) The input shaft also meshes with a gear on a countershaft mounted beside or below it. This countershaft is often referred to as the cluster gear or shaft because it also has a gear for each of the transmission’s lower gears. To complete power transmission in the lower gears, the output shaft has mates for the gears on the cluster. The ratio of each lower gear is a combination of the reduction ratios of the input-to-cluster and cluster-to-output gears. So in each of the lower gears power goes through two gear meshes, producing — you guessed it — double the power loss.
The other major inconsistent factor we have to deal with is the rolling resistance of the tire that we’re measuring the engine’s horsepower and torque through. Harley tires typically carry an H speed rating for sustained maximum speeds of 130 mph. Sportbikes run W (186 mph) or Z (149+ mph) rubber. A tire running above its speed rating, or an underinflated tire, starts to heat up and will eventually fail. Heat indicates friction in the sidewall, and that translates to rolling resistance and increased power losses. With a Harley on the dyno, it shows up as a power loss that increases with speed. In contrast, sportbike tires show zero loss on the dyno, even when approaching 200 mph.
Okay, so where does this all lead? With a constant one-mesh loss, regardless of gear selection, and a tire that adds no loss, a sportbike’s horsepower and torque graphs are virtually identical, whether displayed in third, fourth, fifth, or sixth gear. There’s not much point in printing one here because all of the lines run together. But it’s a different story on a five-speed Harley. With the double-mesh loss in fourth and no loss in fifth, horsepower and torque will always read higher in fifth, right? Not so fast, or, rather, too fast for the H-rated tire, that is.
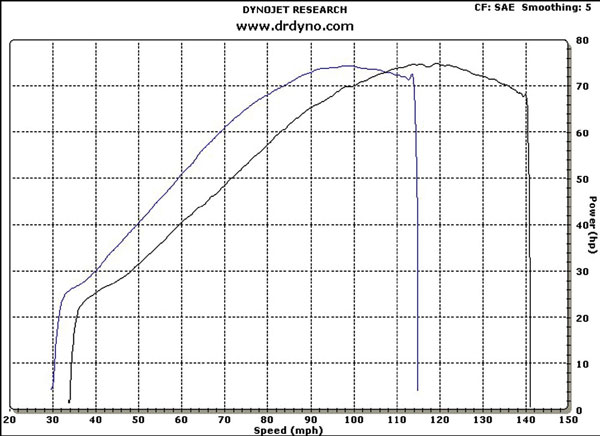
Using Joe’s Road King as an example, the Horsepower Vs. MPH graph shows what the rear tire’s rolling resistance causes in the horsepower curve (black line) above 120 mph. By the time we hit the rev limiter at 140 mph, the curve is in a steep dive, especially when compared with the blue line, which is the horsepower in fourth between 100 and 115 mph. Note that these speeds are confined to the dyno where doing a buck-forty in the parking lot is a blast — and, no, your bike won’t go that fast, unless you have a 140-mph tailwind! Also note, I exceeded the tire’s 130- speed rating for less than two seconds.
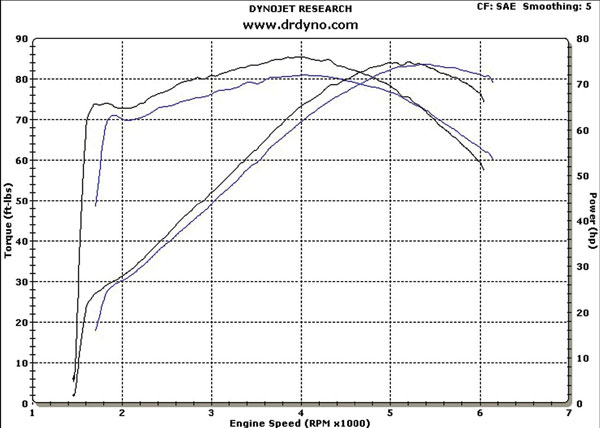
Now, let’s bring in the torque curves and overlay the fourth and fifth gear runs by comparing them with engine speed. The first thing to note is the different scaling used on the vertical axis: 90 ft-lbs. for the torque on the left and 80 hp for the power on the right. This makes the horsepower and torque curves for each gear cross at about 4700 rpm, a scaling illusion that causes much confusion and many a question. Be assured that all is well in dynoland, and that at 5252 rpm, the horsepower and torque values are still equal. Unequal scaling doesn’t change the data, just its appearance at first glance. I purposely used this scaling to move the crossover away from another area of interest.
Okay, back to our fourth/fifth analysis. The loss advantage fifth gear has over fourth practically jumps off the page in the torque curves where, at 4000 rpm, fifth (black) beats fourth (blue) by almost 5 ft-lbs. Two to 5 ft-lbs lower in fourth is typically what I see. Notice that as rpm and speed increase, fifth gear loses its advantage over fourth, until at about 5400 rpm, the rolling resistance of the tire at 123 mph in fifth (100 mph in fourth) has equaled the transmission’s advantage. In this case, fourth and fifth read almost identical horsepower. Depending on the bike’s top speed gearing and the tire’s pressure, many times fourth gear may win the horsepower crown. (The actual peak numbers in this example are 80.85 ft-lbs., 74.27 hp in fourth, and 85.38 ft-lbs., 74.75 hp in fifth.)
CONCLUSIONS
When you take your bike (any brand) for dyno testing, you should be comfortable with the way your bike is being handled. You wouldn’t hand your keys to just anyone, would you? (A touch of nervousness is perfectly normal.) Don’t let long waiting lines at a “popular” dyno dissuade you from asking questions. If you can’t get your questions answered to your reasonable satisfaction, you may be getting set up to have your wallet “tuned.” Get a second opinion and explanation, especially from someone who isn’t selling what the other guy wants to sell you.
Have your tires properly inflated. I like to see 35-38 psi on Harleys. Don’t forget the front tire. Also check for foreign objects (no, not Hondas) in your tires. Occasionally, I have a tire go flat on the dyno when something flies out at 140 mph!
Ask what gear the operator normally tests in. Many use fourth because it’s quicker. You’re paying, so request the gear or gears you prefer.
Make sure you get two nearly identical runs as a true baseline test. Also check for SAE correction and smoothing factor 5.
If you run into a bad apple, have him change your burnt spark plugs and dirty air cleaner at a reasonable price. Then take your bike to a legitimate dyno operator for a test and real tune-up.
And, finally, remember that dyno testing and tuning is a business, and you’re the buyer. Get what you’re paying for. Why shouldn’t you get the most for your dyno dollar? AIM
Editor’s Note: After working as an Electronic research and design engineer for the U.S. Department of Defense in New London, Connecticut, for 22 years, Dr. Dyno, aka Fred Eno, retired and sometime later bought his own dyno. After several years of testing and tuning Harleys, he formed Eno Enterprises LLC in 2000 and conferred on himself the title Dr. Dyno (www.DrDyno.com). I have spent a lot of time with Fred in the dyno room and can attest to the fact that he knows his business. — Chris


